Training data spans 9,110 products across
493 taxonomies.
Of 29,567 total tags in the dataset,
11,353 tags were used
(tags appearing fewer than 5 times were filtered out).
5,490 products were discarded due to missing or sparse taxonomy labels.Explore the full dataset → | View defective taxonomy labels →
Dummy Baseline
Always predicts most common taxonomy (baseline for comparison)
Distribution of products across the most common taxonomy classes
Top 10 taxonomy classes
Taxonomy ID
Name
Path
Samples
Share
gid://shopify/TaxonomyCategory/bt
Baby & Toddler
4
94
1.0%
gid://shopify/TaxonomyCategory/lb
Luggage & Bags
15
82
0.9%
gid://shopify/TaxonomyCategory/bu
Bundles
5
30
0.3%
gid://shopify/TaxonomyCategory/na
Uncategorized
25
17
0.2%
gid://shopify/TaxonomyCategory/sg
Sporting Goods
23
13
0.1%
gid://shopify/TaxonomyCategory/os
Office Supplies
18
12
0.1%
gid://shopify/TaxonomyCategory/gc
Gift Cards
11
11
0.1%
gid://shopify/TaxonomyCategory/hg
Home & Garden
14
8
0.1%
gid://shopify/TaxonomyCategory/ma
Mature
16
7
0.1%
gid://shopify/TaxonomyCategory/fb
Food, Beverages & Tobacco
9
6
0.1%
Tags with strongest signal
Tag
Top taxonomy
Weight
Max |weight|
FPM
23
3.9876
3.9876
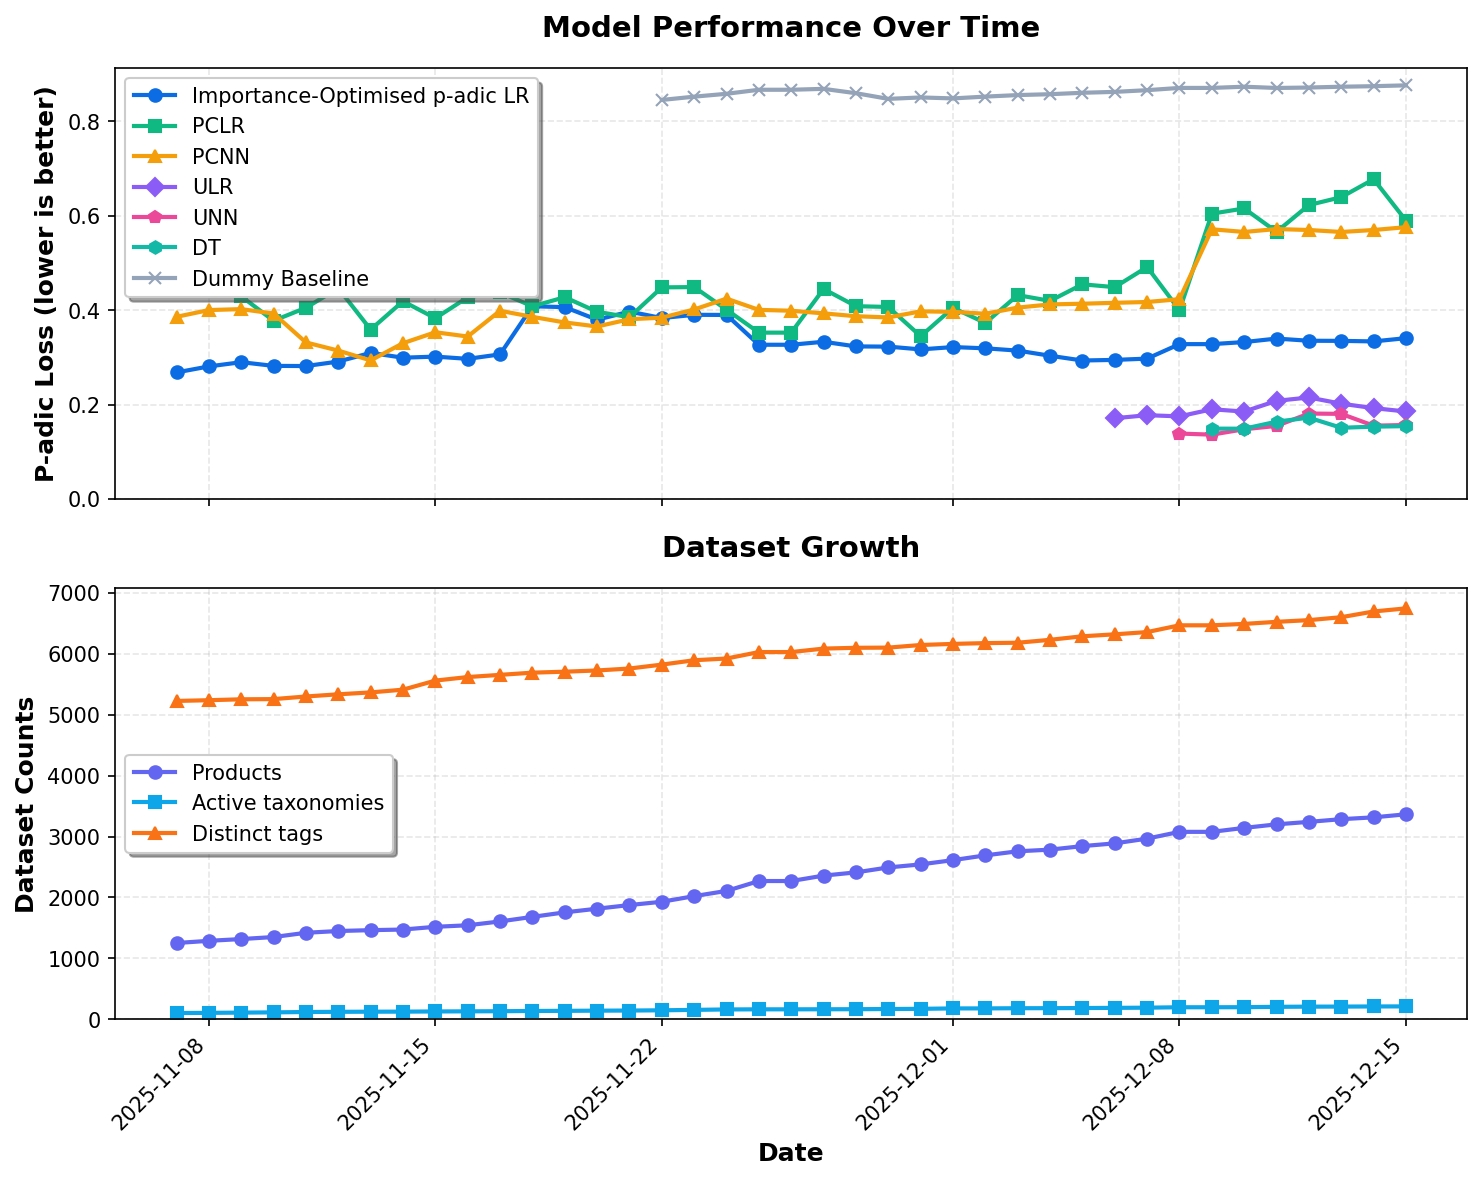
Historical Performance Trends
Tracking model performance and dataset growth over time. Lower p-adic loss indicates better predictions.
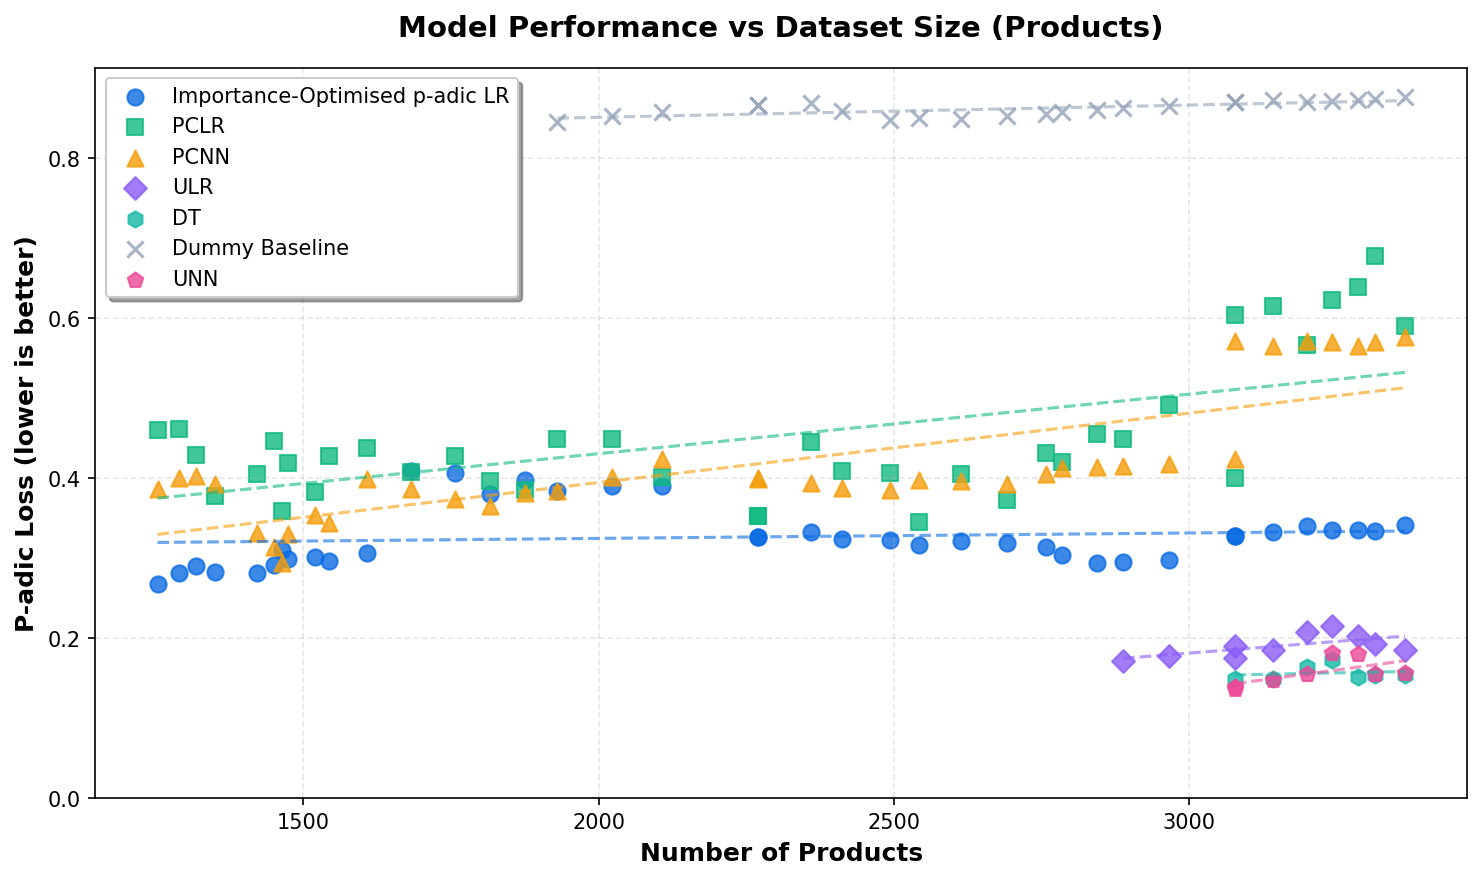
Model
Slope (per product)
Intercept
R²
p-value
Importance-Optimised p-adic LR
0.000009
0.3081
0.4992
1.70e-20
PCLR
0.000044
0.4026
0.6522
1.90e-30
PCNN
0.000044
0.3658
0.7196
2.55e-36
ULR
0.000006
0.1871
0.4820
2.25e-15
UNN
0.000011
0.1349
0.6477
5.11e-23
Decision Tree
0.000005
0.1568
0.4341
3.92e-13
Zubarev (UMLLR)
0.000008
0.3606
0.6758
2.99e-22
Zubarev (zeros)
0.000013
0.3589
0.7864
6.74e-30
Zubarev (M1)
0.000003
0.3936
0.4531
1.25e-12
Zubarev (M2)
0.000005
0.3805
0.6238
1.61e-19
Dummy Baseline
-0.000056
1.0247
0.7712
5.03e-37
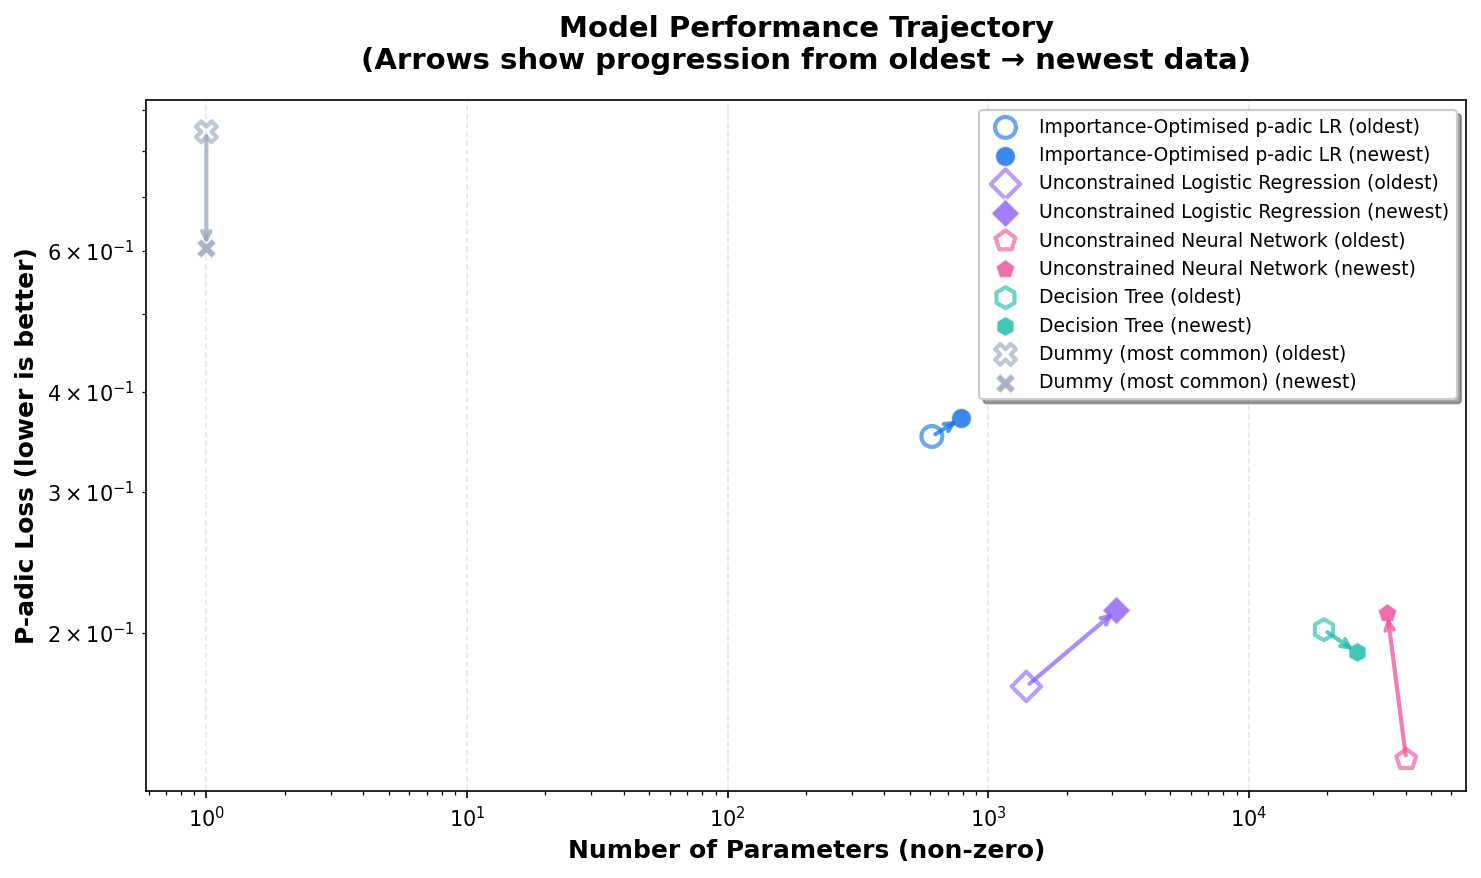
Extrapolation Analysis: When Will Importance-Optimised p-adic LR Outperform Other Models?
Based on current regression trends, we can extrapolate when Importance-Optimised p-adic LR
will achieve better performance (lower p-adic loss) than other models as the dataset grows.
The confidence intervals are calculated using bootstrap resampling (n=1000).
Statistical Notes: The crossover points are calculated by finding where the
regression lines intersect. The 95% confidence intervals are derived from bootstrap resampling
of the regression parameters. The probability estimates indicate the likelihood that the crossover
will occur given the current trends. Date predictions are based on linear extrapolation of dataset
growth and should be interpreted with caution.
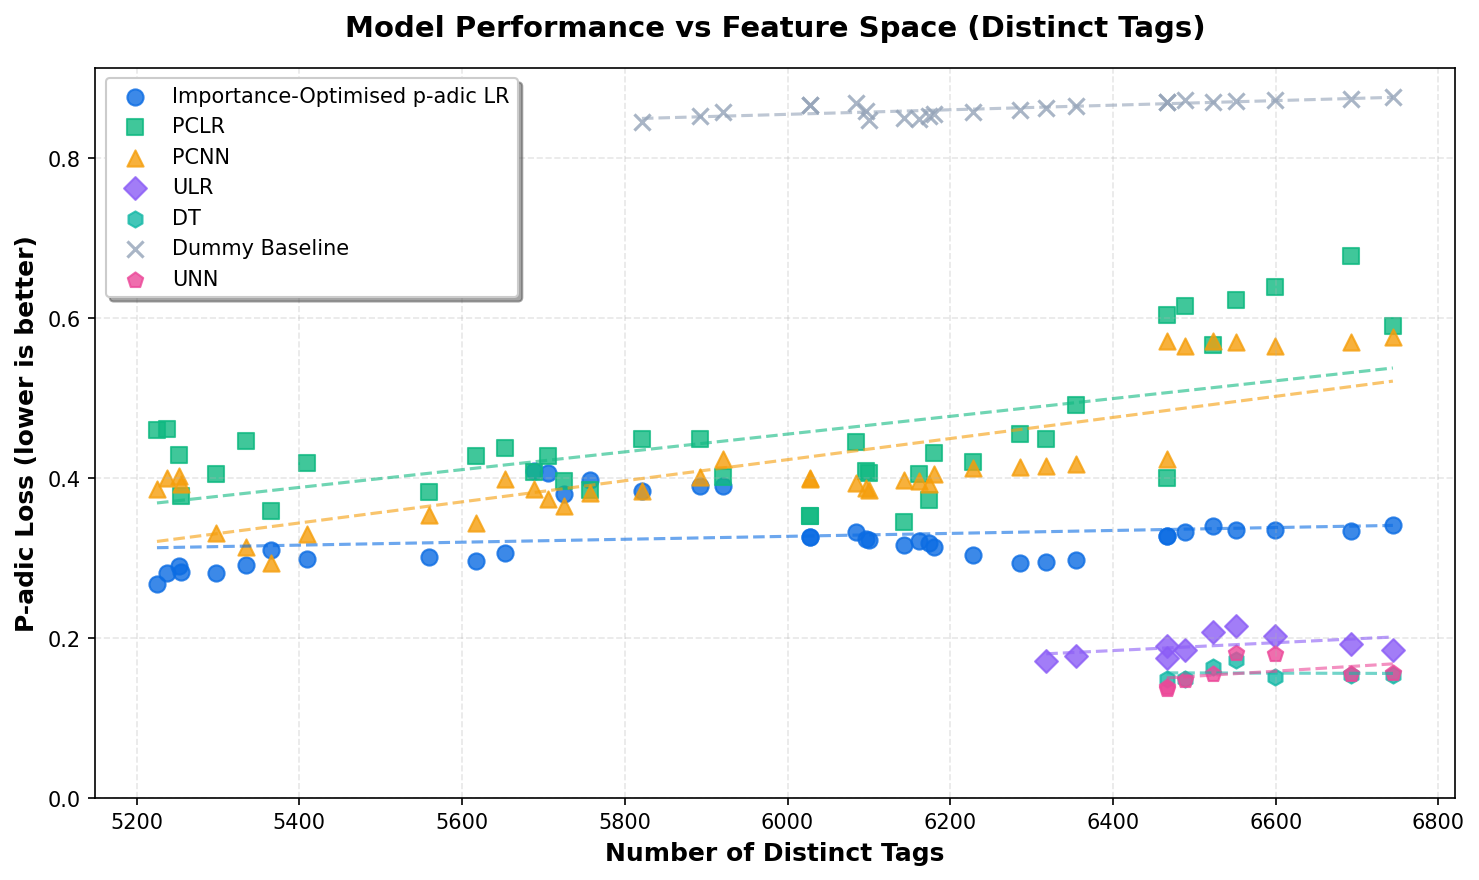
Model
Slope (per tag)
Intercept
R²
p-value
Importance-Optimised p-adic LR
0.000012
0.2579
0.5296
3.27e-22
PCLR
0.000055
0.1639
0.6829
5.74e-33
PCNN
0.000055
0.1279
0.7510
1.49e-39
ULR
0.000008
0.1539
0.5057
2.31e-16
UNN
0.000015
0.0652
0.7251
4.20e-28
Decision Tree
0.000006
0.1281
0.4661
2.54e-14
Zubarev (UMLLR)
0.000011
0.3092
0.7451
1.18e-26
Zubarev (zeros)
0.000018
0.2758
0.8393
4.24e-35
Zubarev (M1)
0.000005
0.3719
0.4851
9.59e-14
Zubarev (M2)
0.000007
0.3476
0.6590
2.54e-21
Dummy Baseline
-0.000070
1.3238
0.8032
1.25e-40
Extrapolation Analysis: When Will Importance-Optimised p-adic LR Outperform Other Models?
Based on current regression trends, we can extrapolate when Importance-Optimised p-adic LR
will achieve better performance (lower p-adic loss) than other models as the dataset grows.
The confidence intervals are calculated using bootstrap resampling (n=1000).
Statistical Notes: The crossover points are calculated by finding where the
regression lines intersect. The 95% confidence intervals are derived from bootstrap resampling
of the regression parameters. The probability estimates indicate the likelihood that the crossover
will occur given the current trends. Date predictions are based on linear extrapolation of dataset
growth and should be interpreted with caution.
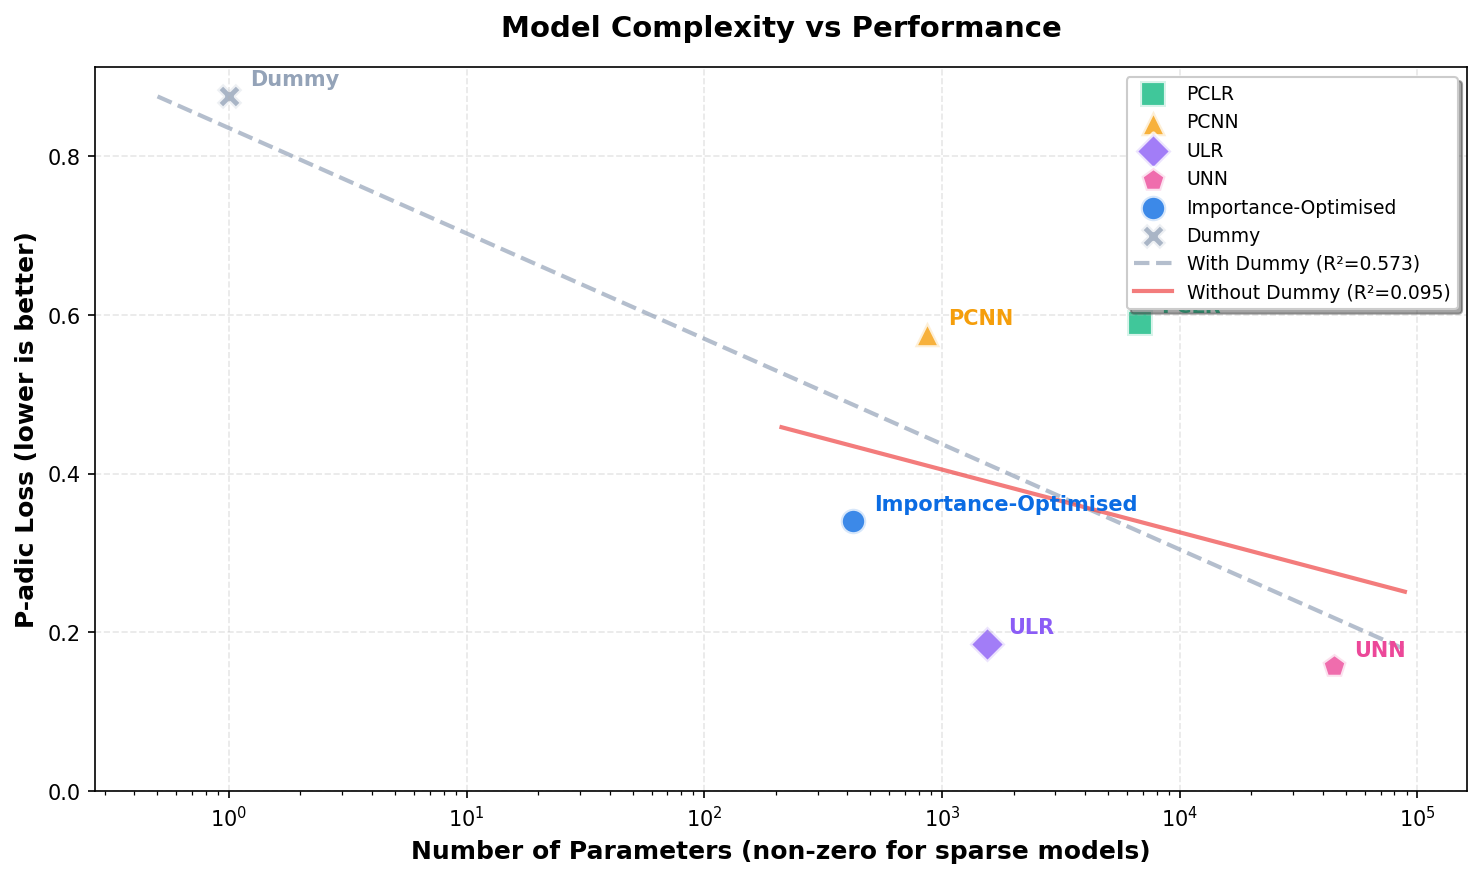
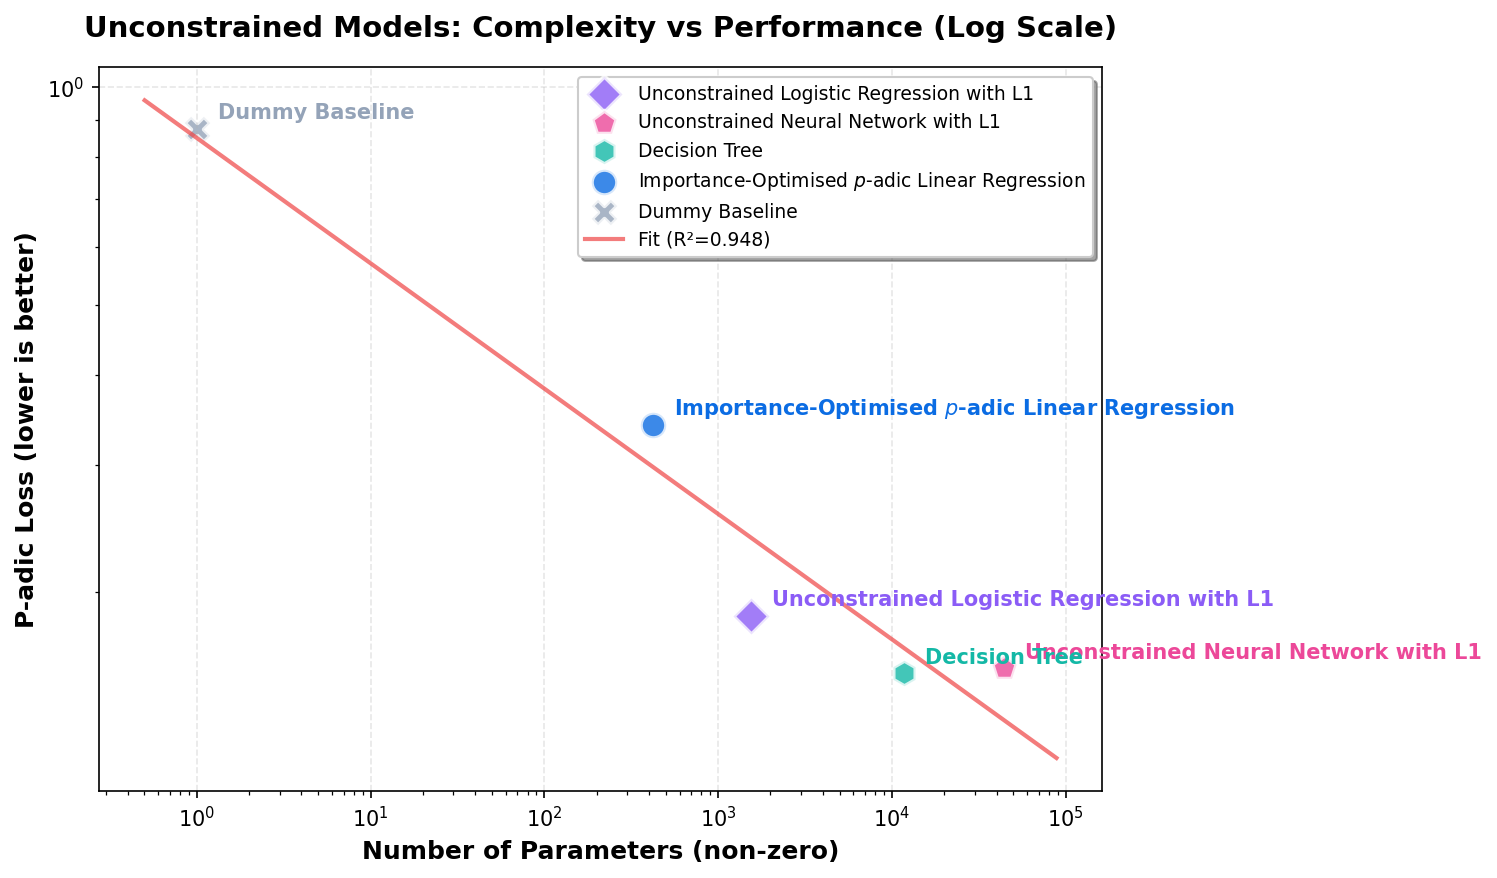
Both axes use log scale. The red line is the fixed parsimoniousness baseline rather than a fitted regression.
Why parsimony matters.
The question here is not just which model has the lowest loss, but which model gets good p-adic loss with the fewest effective parameters. That is exactly where the smaller p-adic models are interesting.
Where this baseline came from.
The original score came from a log-log regression on model size versus loss, rounded to
-0.1 × log₁₀(params) - 0.2. Looking across historical snapshots, those scores drifted as the dataset covered more taxonomies, so the current baseline adds
+ 0.3 × log₁₀(taxonomies / 1,000) to keep comparisons stable as the benchmark grows. For readability, we also re-centre the displayed score by dropping the old constant offset; that keeps the current tables mostly positive without changing the relative comparisons.
Parsimoniousness baseline: log₁₀(loss) = -0.1 × log₁₀(params) + 0.3 × log₁₀(taxonomies / 1,000) Current snapshot taxonomies: 493 Parsimony score = baseline log₁₀(loss) − observed log₁₀(loss). Positive means better than baseline.
Model
Params
Loss
log₁₀(params)
log₁₀(loss)
Baseline log₁₀(loss)
Parsimony score
Level-wise Logistic
132,415
0.1008
5.1219
-0.9966
-0.6043
+0.3923
ULR
4,552
0.2416
3.6582
-0.6170
-0.4580
+0.1590
Dummy
1
0.5825
0.0000
-0.2347
-0.0921
+0.1426
Decision Tree
40,902
0.2081
4.6117
-0.6818
-0.5533
+0.1285
UNN
27,154
0.2279
4.4338
-0.6423
-0.5355
+0.1067
Importance-Optimised
1,103
0.3778
3.0427
-0.4227
-0.3964
+0.0263
Zubarev (M1)
2,727
0.4253
3.4357
-0.3714
-0.4357
-0.0644
Zubarev (M2)
2,732
0.4261
3.4365
-0.3705
-0.4358
-0.0653
Zubarev (UMLLR)
2,901
0.4273
3.4626
-0.3693
-0.4384
-0.0691
Zubarev (zeros)
3,048
0.4586
3.4840
-0.3385
-0.4406
-0.1020
PCNN
864
0.6923
2.9365
-0.1597
-0.3858
-0.2261
PCLR
15,661
0.6650
4.1948
-0.1772
-0.5116
-0.3344
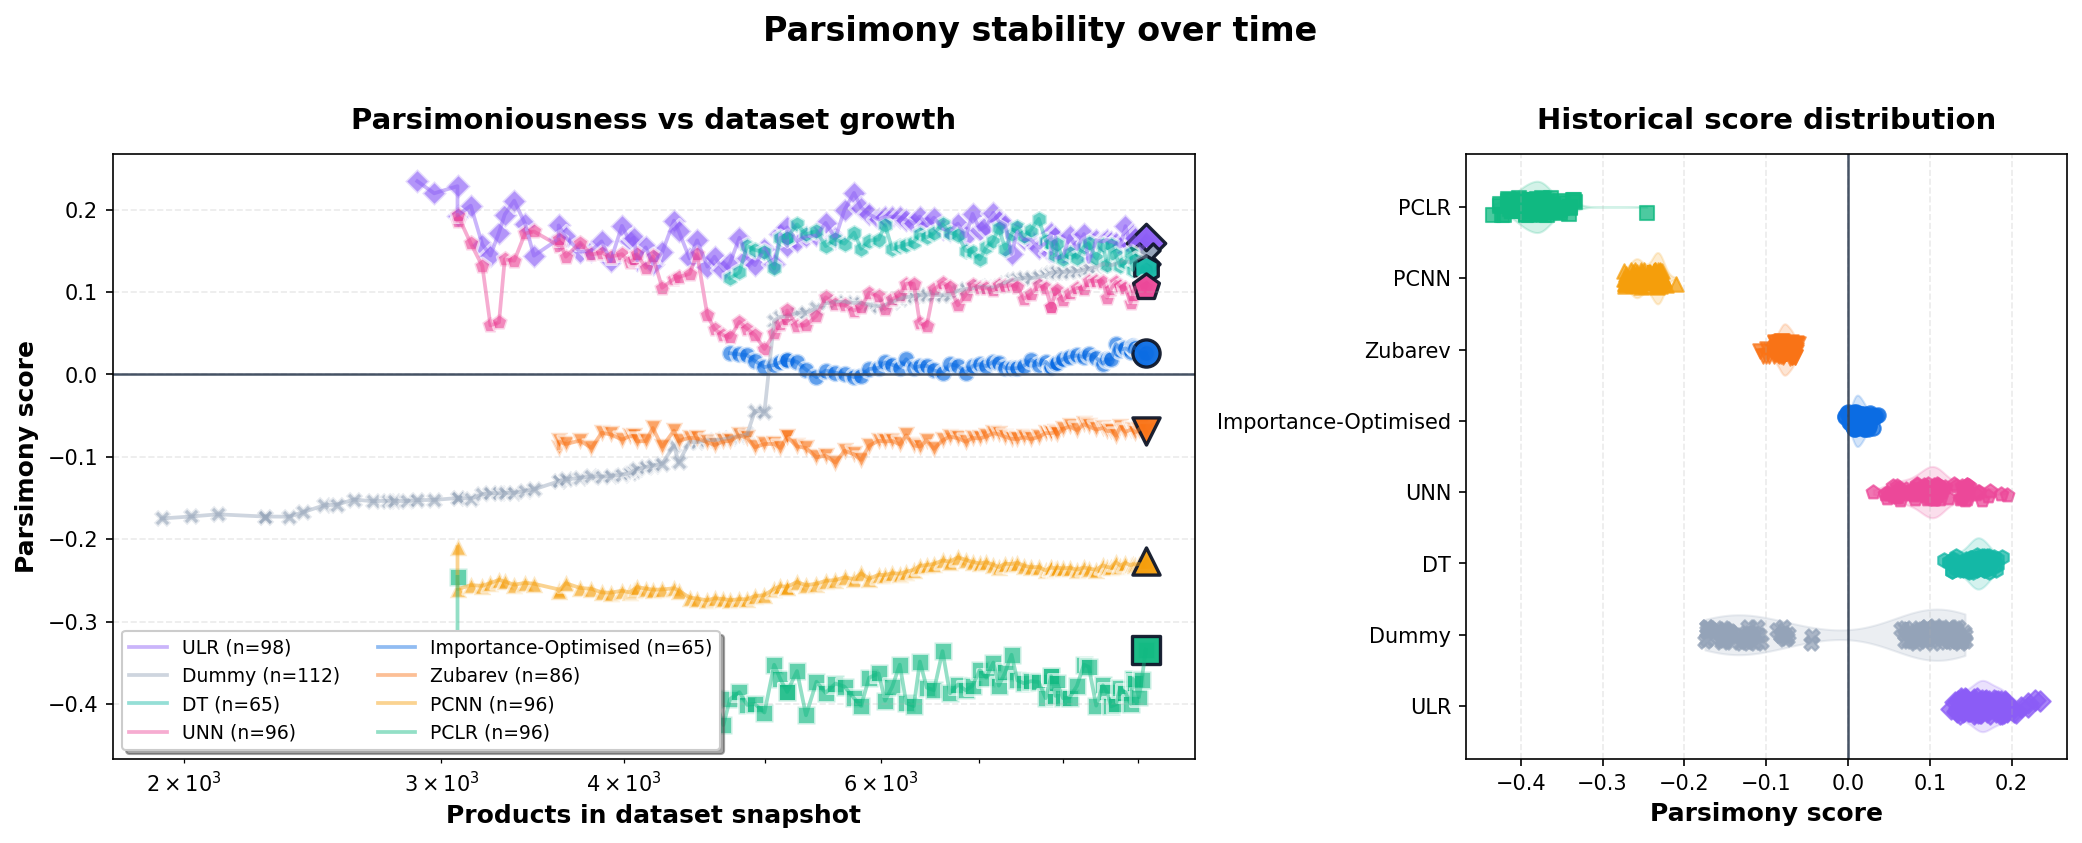
Left: parsimony score versus dataset size. Right: score distribution across historical snapshots. Positive means better than the taxonomy-adjusted baseline.
Model
Snapshots
Mean score
Std dev
Span
Latest score
Latest products
Unconstrained Logistic Regression with L1
98
+0.1689
0.0223
0.1083
+0.1590
9,110
Dummy Baseline
112
-0.0013
0.1216
0.3180
+0.1426
9,110
Decision Tree
65
+0.1555
0.0165
0.0720
+0.1285
9,110
Unconstrained Neural Network with L1
96
+0.1042
0.0332
0.1631
+0.1067
9,110
Importance-Optimised $p$-adic Linear Regression
65
+0.0144
0.0091
0.0402
+0.0263
9,110
Zubarev (UMLLR init)
86
-0.0781
0.0095
0.0465
-0.0692
9,110
PCNN
96
-0.2460
0.0154
0.0646
-0.2261
9,110
PCLR
96
-0.3806
0.0257
0.1880
-0.3344
9,110
Smaller standard deviation and span mean a model’s parsimoniousness is more stable as the dataset grows.
Unconstrained models only (no PCLR/PCNN). Both axes on log scale.