frequency
Most common tags first
Ranks tags by how often they appear in the training products.
One ordering change at a time, with the regressor held fixed.
← Back to Latest benchmark summary
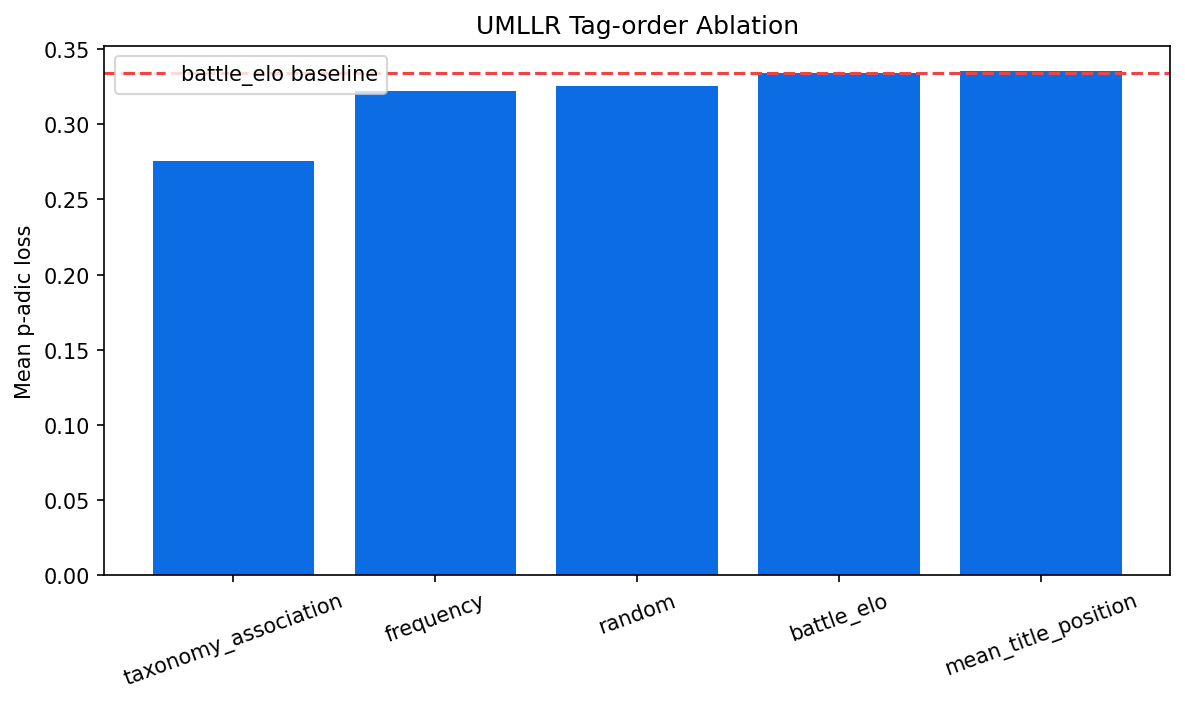
Rolling nightly benchmark compiled from the live operational runs. Best strategy in this bundle: frequency (0.283036 mean p-adic loss).
For these UMLLR ablations, Avg active params / classification is the mean number of active coefficients touched while classifying one product.
The ablation keeps the greedy p-adic regressor fixed and changes only the tag ordering heuristic used before coefficient fitting.
frequencyMost common tags first
Ranks tags by how often they appear in the training products.
taxonomy_associationTaxonomy-peaked tags first
For each tag, measure the share of its training occurrences that land in its single most common taxonomy. Tags with the strongest one-taxonomy association are scored first.
battle_eloPairwise battle ranking
Ranks tags by fold-local Elo scores estimated from tag battles, while excluding the holdout fold from the ranking fit.
mean_title_positionAverage title position
Ranks tags by their average recorded title position in the training products.
randomSeeded random control
Uses a seeded random shuffle of the training tag vocabulary as a control condition.
| Strategy | Mean p-adic loss | Δ vs battle_elo | Fold wins | Exact acc. | Prefix-2 acc. | Avg active params / classification |
|---|---|---|---|---|---|---|
| frequency | 0.283036 | -0.025850 | 5/5 | 54.23% | 60.69% | 1.41 |
| taxonomy_association | 0.293604 | -0.015283 | 5/5 | 57.72% | 60.54% | 0.95 |
| battle_elo | 0.308886 | 0.000000 | 0/5 | 53.74% | 59.05% | 1.15 |
| mean_title_position | 0.325324 | 0.016438 | 1/5 | 51.78% | 57.20% | 1.37 |
| random | 0.326791 | 0.017904 | 2/25 | 52.25% | 56.68% | 1.20 |